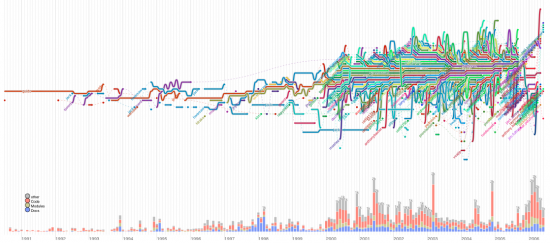
http://flowingdata.com/2010/10/12/software-evolution-storylines/ http://vis.cs.ucdavis.edu/~ogawa/research/storylines/ http://vis.cs.ucdavis.edu/~ogawa/storylines/apache.svg http://vis.cs.ucdavis.edu/~ogawa/storylines/python.svg Data comes from the project repository logs. Time flows horizontally from left to right. At each timestep (usually a month) developers are clustered by the files they modify. A histogram at the bottom shows the volume and type of file committed. You can mouse-over individual lines to see them better. python kicsi png-ben: anr blogja A hozzászóláshoz be kell jelentkezni663 megtekintés