Matthew Garrett: Cordoomceps - replacing an Amiga's brain with Doom
There's a lovely device called a pistorm, an adapter board that glues a Raspberry Pi GPIO bus to a Motorola 68000 bus. The intended use case is that you plug it into a 68000 device and then run an emulator that reads instructions from hardware (ROM or RAM) and emulates them. You're still limited by the ~7MHz bus that the hardware is running at, but you can run the instructions as fast as you want.
These days you're supposed to run a custom built OS on the Pi that just does 68000 emulation, but initially it ran Linux on the Pi and a userland 68000 emulator process. And, well, that got me thinking. The emulator takes 68000 instructions, emulates them, and then talks to the hardware to implement the effects of those instructions. What if we, well, just don't? What if we just run all of our code in Linux on an ARM core and then talk to the Amiga hardware?
We're going to ignore x86 here, because it's weird - but most hardware that wants software to be able to communicate with it maps itself into the same address space that RAM is in. You can write to a byte of RAM, or you can write to a piece of hardware that's effectively pretending to be RAM[1]. The Amiga wasn't unusual in this respect in the 80s, and to talk to the graphics hardware you speak to a special address range that gets sent to that hardware instead of to RAM. The CPU knows nothing about this. It just indicates it wants to write to an address, and then sends the data.
So, if we are the CPU, we can just indicate that we want to write to an address, and provide the data. And those addresses can correspond to the hardware. So, we can write to the RAM that belongs to the Amiga, and we can write to the hardware that isn't RAM but pretends to be. And that means we can run whatever we want on the Pi and then access Amiga hardware.
And, obviously, the thing we want to run is Doom, because that's what everyone runs in fucked up hardware situations.
Doom was Amiga kryptonite. Its entire graphical model was based on memory directly representing the contents of your display, and being able to modify that by just moving pixels around. This worked because at the time VGA displays supported having a memory layout where each pixel on your screen was represented by a byte in memory containing an 8 bit value that corresponded to a lookup table containing the RGB value for that pixel.
The Amiga was, well, not good at this. Back in the 80s, when the Amiga hardware was developed, memory was expensive. Dedicating that much RAM to the video hardware was unthinkable - the Amiga 1000 initially shipped with only 256K of RAM, and you could fill all of that with a sufficiently colourful picture. So instead of having the idea of each pixel being associated with a specific area of memory, the Amiga used bitmaps. A bitmap is an area of memory that represents the screen, but only represents one bit of the colour depth. If you have a black and white display, you only need one bitmap. If you want to display four colours, you need two. More colours, more bitmaps. And each bitmap is stored in an independent area of RAM. You never use more memory than you need to display the number of colours you want to.
But that means that each bitplane contains packed information - every byte of data in a bitplane contains the bit value for 8 different pixels, because each bitplane contains one bit of information per pixel. To update one pixel on screen, you need to read from every bitmap, update one bit, and write it back, and that's a lot of additional memory accesses. Doom, but on the Amiga, was slow not just because the CPU was slow, but because there was a lot of manipulation of data to turn it into the format the Amiga wanted and then push that over a fairly slow memory bus to have it displayed.
The CDTV was an aesthetically pleasing piece of hardware that absolutely sucked. It was an Amiga 500 in a hi-fi box with a caddy-loading CD drive, and it ran software that was just awful. There's no path to remediation here. No compelling apps were ever released. It's a terrible device. I love it. I bought one in 1996 because a local computer store had one and I pointed out that the company selling it had gone bankrupt some years earlier and literally nobody in my farming town was ever going to have any interest in buying a CD player that made a whirring noise when you turned it on because it had a fan and eventually they just sold it to me for not much money, and ever since then I wanted to have a CD player that ran Linux and well spoiler 30 years later I'm nearly there. That CDTV is going to be our test subject. We're going to try to get Doom running on it without executing any 68000 instructions.
We're facing two main problems here. The first is that all Amigas have a firmware ROM called Kickstart that runs at powerup. No matter how little you care about using any OS functionality, you can't start running your code until Kickstart has run. This means even documentation describing bare metal Amiga programming assumes that the hardware is already in the state that Kickstart left it in. This will become important later. The second is that we're going to need to actually write the code to use the Amiga hardware.
First, let's talk about Amiga graphics. We've already covered bitmaps, but for anyone used to modern hardware that's not the weirdest thing about what we're dealing with here. The CDTV's chipset supports a maximum of 64 colours in a mode called "Extra Half-Brite", or EHB, where you have 32 colours arbitrarily chosen from a palette and then 32 more colours that are identical but with half the intensity. For 64 colours we need 6 bitplanes, each of which can be located arbitrarily in the region of RAM accessible to the chipset ("chip RAM", distinguished from "fast ram" that's only accessible to the CPU). We tell the chipset where our bitplanes are and it displays them. Or, well, it does for a frame - after that the registers that pointed at our bitplanes no longer do, because when the hardware was DMAing through the bitplanes to display them it was incrementing those registers to point at the next address to DMA from. Which means that every frame we need to set those registers back.
Making sure you have code that's called every frame just to make your graphics work sounds intensely irritating, so Commodore gave us a way to avoid doing that. The chipset includes a coprocessor called "copper". Copper doesn't have a large set of features - in fact, it only has three. The first is that it can program chipset registers. The second is that it can wait for a specific point in screen scanout. The third (which we don't care about here) is that it can optionally skip an instruction if a certain point in screen scanout has already been reached. We can write a program (a "copper list") for the copper that tells it to program the chipset registers with the locations of our bitplanes and then wait until the end of the frame, at which point it will repeat the process. Now our bitplane pointers are always valid at the start of a frame.
Ok! We know how to display stuff. Now we just need to deal with not having 256 colours, and the whole "Doom expects pixels" thing. For the first of these, I stole code from ADoom, the only Amiga doom port I could easily find source for. This looks at the 256 colour palette loaded by Doom and calculates the closest approximation it can within the constraints of EHB. ADoom also includes a bunch of CPU-specific assembly optimisation for converting the "chunky" Doom graphic buffer into the "planar" Amiga bitplanes, none of which I used because (a) it's all for 68000 series CPUs and we're running on ARM, and (b) I have a quad core CPU running at 1.4GHz and I'm going to be pushing all the graphics over a 7.14MHz bus, the graphics mode conversion is not going to be the bottleneck here. Instead I just wrote a series of nested for loops that iterate through each pixel and update each bitplane and called it a day. The set of bitplanes I'm operating on here is allocated on the Linux side so I can read and write to them without being restricted by the speed of the Amiga bus (remember, each byte in each bitplane is going to be updated 8 times per frame, because it holds bits associated with 8 pixels), and then copied over to the Amiga's RAM once the frame is complete.
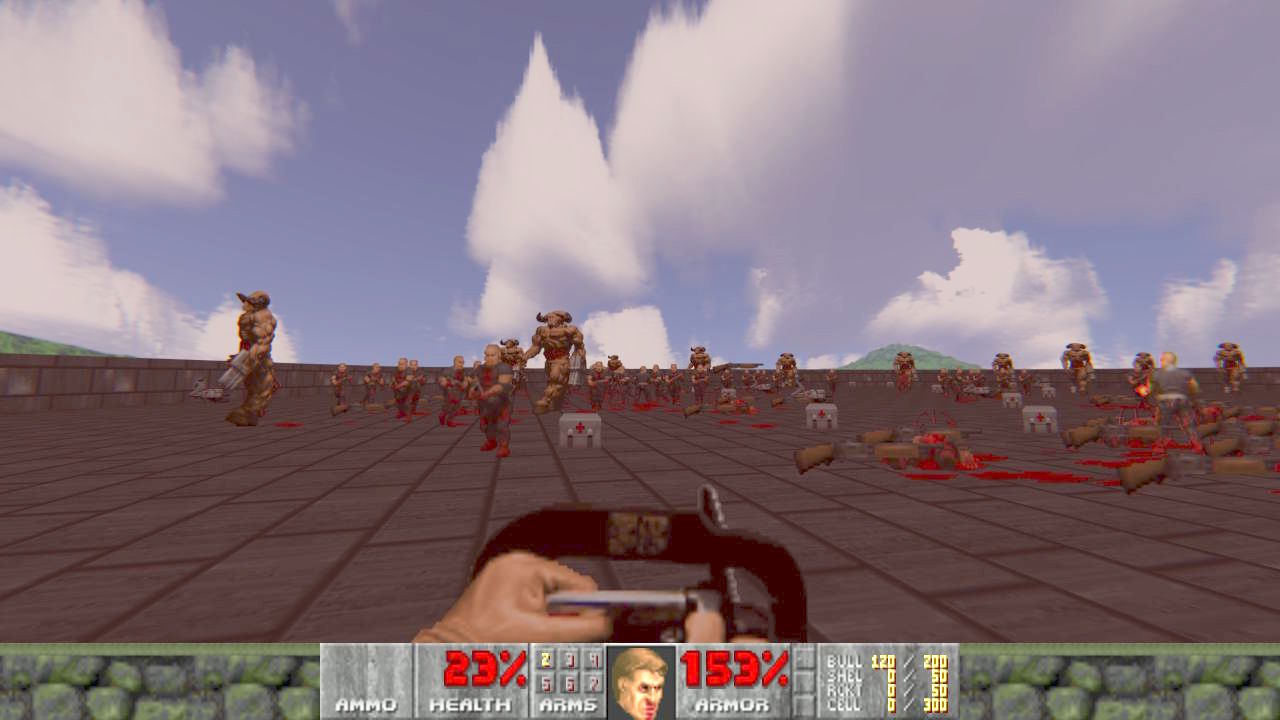
And, kind of astonishingly, this works! Once I'd figured out where I was going wrong with RGB ordering and which order the bitplanes go in, I had a recognisable copy of Doom running. Unfortunately there were weird graphical glitches - sometimes blocks would be entirely the wrong colour. It took me a while to figure out what was going on and then I felt stupid. Recording the screen and watching in slow motion revealed that the glitches often showed parts of two frames displaying at once. The Amiga hardware is taking responsibility for scanning out the frames, and the code on the Linux side isn't synchronised with it at all. That means I could update the bitplanes while the Amiga was scanning them out, resulting in a mashup of planes from two different Doom frames being used as one Amiga frame. One approach to avoid this would be to tie the Doom event loop to the Amiga, blocking my writes until the end of scanout. The other is to use double-buffering - have two sets of bitplanes, one being displayed and the other being written to. This consumes more RAM but since I'm not using the Amiga RAM for anything else that's not a problem. With this approach I have two copper lists, one for each set of bitplanes, and switch between them on each frame. This improved things a lot but not entirely, and there's still glitches when the palette is being updated (because there's only one set of colour registers), something Doom does rather a lot, so I'm going to need to implement proper synchronisation.
Except. This was only working if I ran a 68K emulator first in order to run Kickstart. If I tried accessing the hardware without doing that, things were in a weird state. I could update the colour registers, but accessing RAM didn't work - I could read stuff out, but anything I wrote vanished. Some more digging cleared that up. When you turn on a CPU it needs to start executing code from somewhere. On modern x86 systems it starts from a hardcoded address of 0xFFFFFFF0, which was traditionally a long way any RAM. The 68000 family instead reads its start address from address 0x00000004, which overlaps with where the Amiga chip RAM is. We can't write anything to RAM until we're executing code, and we can't execute code until we tell the CPU where the code is, which seems like a problem. This is solved on the Amiga by powering up in a state where the Kickstart ROM is "overlayed" onto address 0. The CPU reads the start address from the ROM, which causes it to jump into the ROM and start executing code there. Early on, the code tells the hardware to stop overlaying the ROM onto the low addresses, and now the RAM is available. This is poorly documented because it's not something you need to care if you execute Kickstart which every actual Amiga does and I'm only in this position because I've made poor life choices, but ok that explained things. To turn off the overlay you write to a register in one of the Complex Interface Adaptor (CIA) chips, and things start working like you'd expect.
Except, they don't. Writing to that register did nothing for me. I assumed that there was some other register I needed to write to first, and went to the extent of tracing every register access that occurred when running the emulator and replaying those in my code. Nope, still broken. What I finally discovered is that you need to pulse the reset line on the board before some of the hardware starts working - powering it up doesn't put you in a well defined state, but resetting it does.
So, I now have a slightly graphically glitchy copy of Doom running without any sound, displaying on an Amiga whose brain has been replaced with a parasitic Linux. Further updates will likely make things even worse. Code is, of course, available.
[1] This is why we had trouble with late era 32 bit systems and 4GB of RAM - a bunch of your hardware wanted to be in the same address space and so you couldn't put RAM there so you ended up with less than 4GB of RAM
comments
These days you're supposed to run a custom built OS on the Pi that just does 68000 emulation, but initially it ran Linux on the Pi and a userland 68000 emulator process. And, well, that got me thinking. The emulator takes 68000 instructions, emulates them, and then talks to the hardware to implement the effects of those instructions. What if we, well, just don't? What if we just run all of our code in Linux on an ARM core and then talk to the Amiga hardware?
We're going to ignore x86 here, because it's weird - but most hardware that wants software to be able to communicate with it maps itself into the same address space that RAM is in. You can write to a byte of RAM, or you can write to a piece of hardware that's effectively pretending to be RAM[1]. The Amiga wasn't unusual in this respect in the 80s, and to talk to the graphics hardware you speak to a special address range that gets sent to that hardware instead of to RAM. The CPU knows nothing about this. It just indicates it wants to write to an address, and then sends the data.
So, if we are the CPU, we can just indicate that we want to write to an address, and provide the data. And those addresses can correspond to the hardware. So, we can write to the RAM that belongs to the Amiga, and we can write to the hardware that isn't RAM but pretends to be. And that means we can run whatever we want on the Pi and then access Amiga hardware.
And, obviously, the thing we want to run is Doom, because that's what everyone runs in fucked up hardware situations.
Doom was Amiga kryptonite. Its entire graphical model was based on memory directly representing the contents of your display, and being able to modify that by just moving pixels around. This worked because at the time VGA displays supported having a memory layout where each pixel on your screen was represented by a byte in memory containing an 8 bit value that corresponded to a lookup table containing the RGB value for that pixel.
The Amiga was, well, not good at this. Back in the 80s, when the Amiga hardware was developed, memory was expensive. Dedicating that much RAM to the video hardware was unthinkable - the Amiga 1000 initially shipped with only 256K of RAM, and you could fill all of that with a sufficiently colourful picture. So instead of having the idea of each pixel being associated with a specific area of memory, the Amiga used bitmaps. A bitmap is an area of memory that represents the screen, but only represents one bit of the colour depth. If you have a black and white display, you only need one bitmap. If you want to display four colours, you need two. More colours, more bitmaps. And each bitmap is stored in an independent area of RAM. You never use more memory than you need to display the number of colours you want to.
But that means that each bitplane contains packed information - every byte of data in a bitplane contains the bit value for 8 different pixels, because each bitplane contains one bit of information per pixel. To update one pixel on screen, you need to read from every bitmap, update one bit, and write it back, and that's a lot of additional memory accesses. Doom, but on the Amiga, was slow not just because the CPU was slow, but because there was a lot of manipulation of data to turn it into the format the Amiga wanted and then push that over a fairly slow memory bus to have it displayed.
The CDTV was an aesthetically pleasing piece of hardware that absolutely sucked. It was an Amiga 500 in a hi-fi box with a caddy-loading CD drive, and it ran software that was just awful. There's no path to remediation here. No compelling apps were ever released. It's a terrible device. I love it. I bought one in 1996 because a local computer store had one and I pointed out that the company selling it had gone bankrupt some years earlier and literally nobody in my farming town was ever going to have any interest in buying a CD player that made a whirring noise when you turned it on because it had a fan and eventually they just sold it to me for not much money, and ever since then I wanted to have a CD player that ran Linux and well spoiler 30 years later I'm nearly there. That CDTV is going to be our test subject. We're going to try to get Doom running on it without executing any 68000 instructions.
We're facing two main problems here. The first is that all Amigas have a firmware ROM called Kickstart that runs at powerup. No matter how little you care about using any OS functionality, you can't start running your code until Kickstart has run. This means even documentation describing bare metal Amiga programming assumes that the hardware is already in the state that Kickstart left it in. This will become important later. The second is that we're going to need to actually write the code to use the Amiga hardware.
First, let's talk about Amiga graphics. We've already covered bitmaps, but for anyone used to modern hardware that's not the weirdest thing about what we're dealing with here. The CDTV's chipset supports a maximum of 64 colours in a mode called "Extra Half-Brite", or EHB, where you have 32 colours arbitrarily chosen from a palette and then 32 more colours that are identical but with half the intensity. For 64 colours we need 6 bitplanes, each of which can be located arbitrarily in the region of RAM accessible to the chipset ("chip RAM", distinguished from "fast ram" that's only accessible to the CPU). We tell the chipset where our bitplanes are and it displays them. Or, well, it does for a frame - after that the registers that pointed at our bitplanes no longer do, because when the hardware was DMAing through the bitplanes to display them it was incrementing those registers to point at the next address to DMA from. Which means that every frame we need to set those registers back.
Making sure you have code that's called every frame just to make your graphics work sounds intensely irritating, so Commodore gave us a way to avoid doing that. The chipset includes a coprocessor called "copper". Copper doesn't have a large set of features - in fact, it only has three. The first is that it can program chipset registers. The second is that it can wait for a specific point in screen scanout. The third (which we don't care about here) is that it can optionally skip an instruction if a certain point in screen scanout has already been reached. We can write a program (a "copper list") for the copper that tells it to program the chipset registers with the locations of our bitplanes and then wait until the end of the frame, at which point it will repeat the process. Now our bitplane pointers are always valid at the start of a frame.
Ok! We know how to display stuff. Now we just need to deal with not having 256 colours, and the whole "Doom expects pixels" thing. For the first of these, I stole code from ADoom, the only Amiga doom port I could easily find source for. This looks at the 256 colour palette loaded by Doom and calculates the closest approximation it can within the constraints of EHB. ADoom also includes a bunch of CPU-specific assembly optimisation for converting the "chunky" Doom graphic buffer into the "planar" Amiga bitplanes, none of which I used because (a) it's all for 68000 series CPUs and we're running on ARM, and (b) I have a quad core CPU running at 1.4GHz and I'm going to be pushing all the graphics over a 7.14MHz bus, the graphics mode conversion is not going to be the bottleneck here. Instead I just wrote a series of nested for loops that iterate through each pixel and update each bitplane and called it a day. The set of bitplanes I'm operating on here is allocated on the Linux side so I can read and write to them without being restricted by the speed of the Amiga bus (remember, each byte in each bitplane is going to be updated 8 times per frame, because it holds bits associated with 8 pixels), and then copied over to the Amiga's RAM once the frame is complete.
And, kind of astonishingly, this works! Once I'd figured out where I was going wrong with RGB ordering and which order the bitplanes go in, I had a recognisable copy of Doom running. Unfortunately there were weird graphical glitches - sometimes blocks would be entirely the wrong colour. It took me a while to figure out what was going on and then I felt stupid. Recording the screen and watching in slow motion revealed that the glitches often showed parts of two frames displaying at once. The Amiga hardware is taking responsibility for scanning out the frames, and the code on the Linux side isn't synchronised with it at all. That means I could update the bitplanes while the Amiga was scanning them out, resulting in a mashup of planes from two different Doom frames being used as one Amiga frame. One approach to avoid this would be to tie the Doom event loop to the Amiga, blocking my writes until the end of scanout. The other is to use double-buffering - have two sets of bitplanes, one being displayed and the other being written to. This consumes more RAM but since I'm not using the Amiga RAM for anything else that's not a problem. With this approach I have two copper lists, one for each set of bitplanes, and switch between them on each frame. This improved things a lot but not entirely, and there's still glitches when the palette is being updated (because there's only one set of colour registers), something Doom does rather a lot, so I'm going to need to implement proper synchronisation.
Except. This was only working if I ran a 68K emulator first in order to run Kickstart. If I tried accessing the hardware without doing that, things were in a weird state. I could update the colour registers, but accessing RAM didn't work - I could read stuff out, but anything I wrote vanished. Some more digging cleared that up. When you turn on a CPU it needs to start executing code from somewhere. On modern x86 systems it starts from a hardcoded address of 0xFFFFFFF0, which was traditionally a long way any RAM. The 68000 family instead reads its start address from address 0x00000004, which overlaps with where the Amiga chip RAM is. We can't write anything to RAM until we're executing code, and we can't execute code until we tell the CPU where the code is, which seems like a problem. This is solved on the Amiga by powering up in a state where the Kickstart ROM is "overlayed" onto address 0. The CPU reads the start address from the ROM, which causes it to jump into the ROM and start executing code there. Early on, the code tells the hardware to stop overlaying the ROM onto the low addresses, and now the RAM is available. This is poorly documented because it's not something you need to care if you execute Kickstart which every actual Amiga does and I'm only in this position because I've made poor life choices, but ok that explained things. To turn off the overlay you write to a register in one of the Complex Interface Adaptor (CIA) chips, and things start working like you'd expect.
Except, they don't. Writing to that register did nothing for me. I assumed that there was some other register I needed to write to first, and went to the extent of tracing every register access that occurred when running the emulator and replaying those in my code. Nope, still broken. What I finally discovered is that you need to pulse the reset line on the board before some of the hardware starts working - powering it up doesn't put you in a well defined state, but resetting it does.
So, I now have a slightly graphically glitchy copy of Doom running without any sound, displaying on an Amiga whose brain has been replaced with a parasitic Linux. Further updates will likely make things even worse. Code is, of course, available.
[1] This is why we had trouble with late era 32 bit systems and 4GB of RAM - a bunch of your hardware wanted to be in the same address space and so you couldn't put RAM there so you ended up with less than 4GB of RAM
comments